 Download Full PDF Report

The State of Rent 2026: What Renters Are Actually Paying
Average rent paid nears $1,400 as growth continues to cool
Housing affordability remains a top concern for many U.S. households, yet most rental market reports rely on advertised rents for vacant units—not on what renters actually pay each month. The State of Rent offers a different perspective.
Drawing on real rent payment data from thousands of rental units managed through the Rentec Direct platform, this report reveals what renters are paying nationwide. The latest findings show that while the national average monthly rent has reached a new high, rent growth is stabilizing, with notable shifts emerging at the state level.
Understanding the real cost of renting—not just advertised rents—provides a clearer picture of housing affordability and the trends shaping today’s market for more than 100 million renters across the U.S.
Key Findings
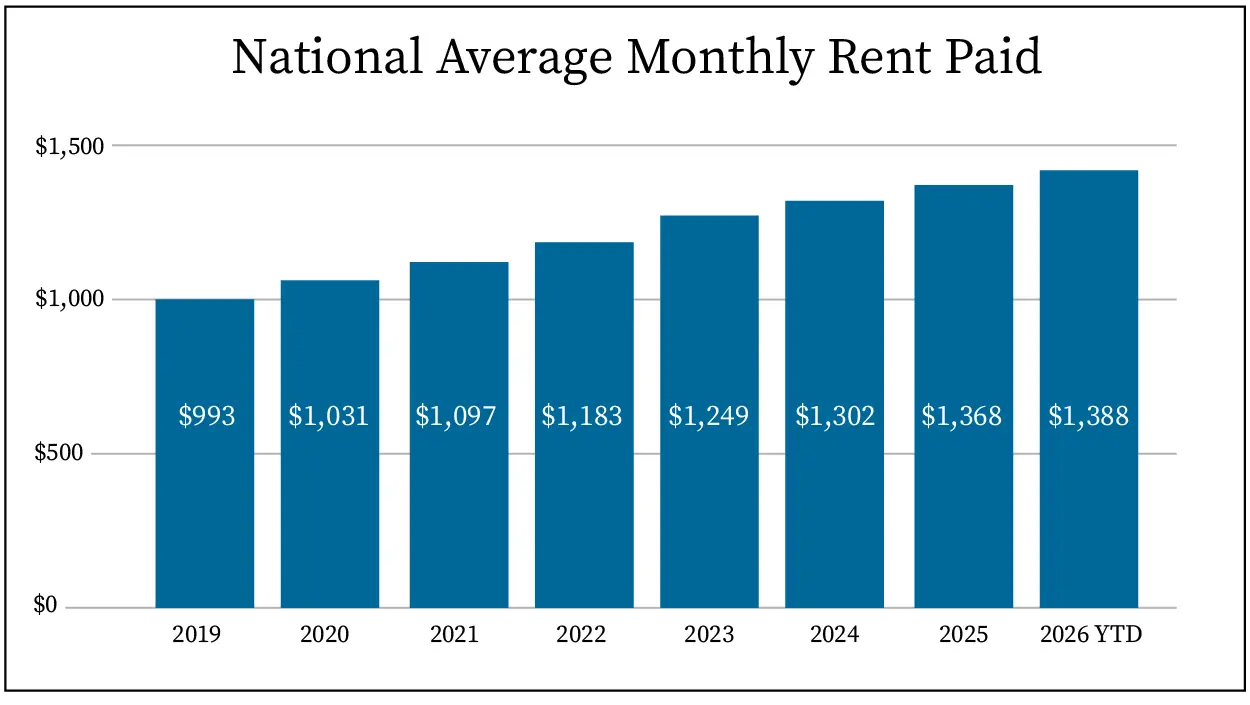
- Renters are feeling the pressure. Average rent paid has increased $375 per month since 2019—a 38% jump. 2026 YTD data shows the upward trend continuing, with average rent reaching $1,388.
- Rent growth is slowing. While average rent paid increased 5% in 2025, 2026 YTD data shows a much more moderate 1% increase.
- The affordability gap is massive. In 2025, renters in California paid an average of $1,626 more per month (3 times as much) than renters in West Virginia. YTD 2026 data shows Hawaii reclaiming the title of highest-cost state.
- Rent trends are moving in different directions. From 2024 to 2025, 41 states experienced rent increases, while only 9 states saw declines. Nearly half of all states (24) recorded rent growth above the national rate of 5%.
Where Renters Are Paying the Most (and Least)
In 2025, coastal states dominated the highest-cost markets, while the most affordable markets were concentrated in Midwest and Southern states.
- California ($2,399)
- Hawaii ($2,185)
- New Jersey ($2,037)
- West Virginia ($773)
- Nebraska ($838)
- North Dakota ($840)
- Arkansas ($953)
- Missouri ($959)
- Minnesota ($970)
- Kentucky ($974)
Where Rent Is Rising and Falling
Rent increased the most in these states (2024-2025):
| State | $ Per Month Increase | % Increase |
|---|---|---|
| Connecticut | ▲ $346 | ▲ 24% |
| California | ▲ $298 | ▲ 14% |
| New Jersey | ▲ $279 | ▲ 16% |
| New York | ▲ $206 | ▲ 15% |
| Louisiana | ▲ $198 | ▲ 24% |
| South Carolina | ▲ $179 | ▲ 14% |
| Montana | ▲ $142 | ▲ 11% |
| South Dakota | ▲ $136 | ▲ 15% |
| Minnesota | ▲ $130 | ▲ 16% |
Rent declined the most in these states (2024-2025):
| State | $ Per Month Decrease | % Decrease |
|---|---|---|
| New Mexico | ▼ $127 | ▼ 10% |
| Colorado | ▼ $121 | ▼ 7% |
| North Dakota | ▼ $66 | ▼ 7% |
| Tennessee | ▼ $66 | ▼ 5% |
Markets to Watch: Early 2026 Signals
Markets Showing Signs of Cooling
States that saw some of the strongest rent increases in 2025 are now losing momentum in 2026 YTD data. Montana, New Jersey, New York and California shifted from double-digit rent growth in 2025 to rent declines in 2026 YTD.
| State | 2025 Growth | 2026 YTD Trend |
|---|---|---|
| Montana | ▲ 11% | ▼ 12% |
| New Jersey | ▲ 16% | ▼ 9% |
| New York | ▲ 15% | ▼ 8% |
| California | ▲ 14% | ▼ 3% |
Markets Showing Signs of Rebound
States that experienced rent declines in 2025 are showing renewed growth in 2026 YTD data. Vermont, North Dakota and New Mexico saw rents fall in 2025 before rebounding in early 2026.
| State | 2025 Growth | 2026 YTD Trend |
|---|---|---|
| Vermont | ▼ 4% | ▲ 13% |
| North Dakota | ▼ 7% | ▲ 10% |
| New Mexico | ▼ 10% | ▲ 9% |
Markets Still Gaining Momentum
Some states are seeing accelerated rent growth in 2026 YTD.
| State | 2025 Growth | 2026 YTD Trend |
|---|---|---|
| Connecticut | ▲ 24% | ▲ 12% |
| Hawaii | ▲ 3% | ▲ 28% |
| Idaho | ▲ 3% | ▲ 14% |
Market Spotlights




What This Means For Housing Providers

Methodology
This report analyzes aggregated, anonymous rent payment data from more than 600,000 rental properties managed through the Rentec Direct platform. The dataset includes single-family and multifamily properties, individual rooms and mobile homes, and excludes commercial properties. Rent payments above $20,000 were omitted as outliers. This report is intended to identify trends and may not fully represent the U.S. rental market as a whole.
Rent Paid vs. Advertised Rent
Data in this report reflects actual rent payments made by tenants, not advertised rent prices for vacant units. Averages are based on real rent transactions from unique lease agreements, providing a more accurate picture of what renters are actually paying each month. Advertised rents can differ from actual payments because they may not reflect existing lease rates, rent control policies, discounts or negotiated prices.